Help with a basic pivot table in Excel
Discussion


I'm not a regular Excel user, but i need to create a load of charts from supplied data and Pivot Tables with slicers to select which data is shown and linked Pivot Charts seem to be the way to go.
But I'm having a stumbling block right at the beginning of my venture...
I've got a table of data, which will be updated once a month with the latest month's figures.
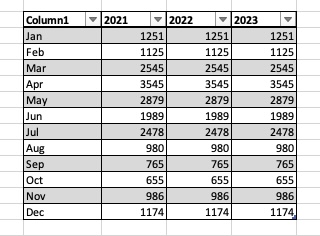
It is formatted with months down the side, years across the top
I want to create a pivot table and then two slicers so i can show data in the table and the chart from the selected Month or Year.
I can create it with a Month slicer so I can pick which months i see, but can't do the same for the years
But I'm having a stumbling block right at the beginning of my venture...
I've got a table of data, which will be updated once a month with the latest month's figures.
It is formatted with months down the side, years across the top
I want to create a pivot table and then two slicers so i can show data in the table and the chart from the selected Month or Year.
I can create it with a Month slicer so I can pick which months i see, but can't do the same for the years
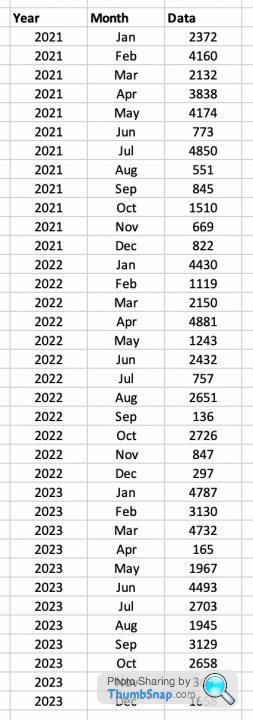
I'd put the data in a 'flat' format.
So you'd have the Year in Column 1, Month in Column 2, and Data in Column 3. Then you have a Year, Month, Data fields to choose in the pivot.
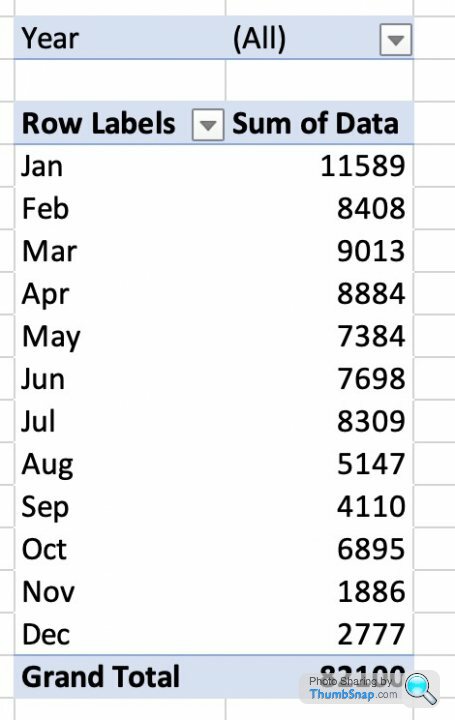
...which would result in a simple pivot like this...
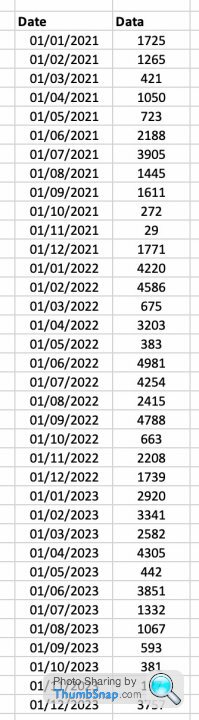
Alternatively, you could just have a single column for whole date, and then use the PivotTable functions to display them into the correct Month/Quarter/Year.
So you'd have the Year in Column 1, Month in Column 2, and Data in Column 3. Then you have a Year, Month, Data fields to choose in the pivot.
...which would result in a simple pivot like this...
Alternatively, you could just have a single column for whole date, and then use the PivotTable functions to display them into the correct Month/Quarter/Year.
Edited by mmm-five on Monday 16th January 15:03
The table you have is pretty much the layout you'd get with a pivot table, are you sure you can't get the plots you want directly from that?
As above you really need it in a flat format to be able to play about with pivot tables, but luckily Excel can do that for you
Define the data as a table by selecting a cell in the table and then going Data-From Table
This will the open the power query editor.
Select a cell in the Month column go to the Transform menu, click the dropdown next to Unpivot Columns and then Unpivot Other Columns.
This will then give you a table in the layout suggested above that you can either put back in to another tab of your spreadsheet (Close and Load to a a new worksheet), or you can create the pivots you want direct for power pivot.
Power tools stuff looks complicated when you first see it but it's pretty simple to use and there are a huge number of videos on youtube on how do anything you want with it, it's well worth having a play with.
Edited by RizzoTheRat on Monday 16th January 21:44
Gassing Station | Computers, Gadgets & Stuff | Top of Page | What's New | My Stuff