Q: SaaS log analysis solution
Discussion


I have OpenCanary systems running, the most interesting of which is in Oracle Cloud.
The logs create webhooks with JSON content:
2022-12-11 01:14:51.000
( json: ( message: "("dst_host": "10.0.0.117", "dst_port": 23, "honeycred": false, "local_time": "2022-12-11 00:14:50.102820", "local_time_adjusted": "2022-12-11 00:14:50.102854", "logdata": ("PASSWORD": "abc123", "USERNAME": "admin"), "logtype": 6001, "node_id": "oc-in-oci.ciso.pm", "src_host": "220.132.69.196", "src_port": 39383, "utc_time": "2022-12-11 00:14:50.102848")" ), http: ( clientHost: "129.213.116.221", contentType: "application/x-www-form-urlencoded" ), derived: ( SourceIP: "220.132.69.196", Username: "admin", Port: "23", DateTime: "2022-12-11 00:14:50", Password: "abc123" ) )
2022-12-11 01:14:49.595
( json: ( message: "("dst_host": "10.0.0.117", "dst_port": 22, "local_time": "2022-12-11 00:14:48.800802", "local_time_adjusted": "2022-12-11 00:14:48.800829", "logdata": ("LOCALVERSION": "SSH-2.0-OpenSSH_5.1p1 Debian-4", "PASSWORD": "tcl", "REMOTEVERSION": "SSH-2.0-libssh_0.9.6", "USERNAME": "tcl"), "logtype": 4002, "node_id": "oc-in-oci.ciso.pm", "src_host": "167.71.158.66", "src_port": 35314, "utc_time": "2022-12-11 00:14:48.800822")" ), http: ( clientHost: "129.213.116.221", contentType: "application/x-www-form-urlencoded" ), derived: ( SourceIP: "167.71.158.66", Username: "tcl", Port: "22", DateTime: "2022-12-11 00:14:48", Password: "tcl" ) )
2022-12-11 01:14:48.678
( json: ( message: "("dst_host": "10.0.0.117", "dst_port": 22, "local_time": "2022-12-11 00:14:47.888568", "local_time_adjusted": "2022-12-11 00:14:47.888596", "logdata": ("LOCALVERSION": "SSH-2.0-OpenSSH_5.1p1 Debian-4", "REMOTEVERSION": "SSH-2.0-libssh_0.9.6"), "logtype": 4001, "node_id": "oc-in-oci.ciso.pm", "src_host": "167.71.158.66", "src_port": 35314, "utc_time": "2022-12-11 00:14:47.888590")" ), http: ( clientHost: "129.213.116.221", contentType: "application/x-www-form-urlencoded" ), derived: ( SourceIP: "167.71.158.66", Port: "22", DateTime: "2022-12-11 00:14:47" ) )
2022-12-11 01:14:47.490
( json: ( message: "("dst_host": "10.0.0.117", "dst_port": 22, "local_time": "2022-12-11 00:14:46.611922", "local_time_adjusted": "2022-12-11 00:14:46.611975", "logdata": ("SESSION": "15352"), "logtype": 4000, "node_id": "oc-in-oci.ciso.pm", "src_host": "167.71.158.66", "src_port": 35314, "utc_time": "2022-12-11 00:14:46.611965")" ), http: ( clientHost: "129.213.116.221", contentType: "application/x-www-form-urlencoded" ), derived: ( SourceIP: "167.71.158.66", Port: "22", DateTime: "2022-12-11 00:14:46" ) )
The log file has the following lines.
("dst_host": "127.0.0.1", "dst_port": "51768", "local_time": "2022-06-16 07:48:44.755838", "local_time_adjusted": "2022-06-16 07:48:44.755850", "logdata": ("ACK": "", "DF": "", "ID": "25088", "IN": "lo", "LEN": "52", "MAC": "00:00:00:00:00:00:00:00:00:00:00:00:08:00", "OUT": "", "PREC": "0x00", "PROTO": "TCP", "RES": "0x00", "TOS": "0x00", "TTL": "64", "URGP": "0", "WINDOW": "512"), "logtype": 5001, "node_id": "SynologyDS", "src_host": "127.0.0.1", "src_port": "23", "utc_time": "2022-06-16 07:48:44.755847")
("dst_host": "127.0.0.1", "dst_port": 23, "honeycred": false, "local_time": "2022-06-16 07:48:49.517501", "local_time_adjusted": "2022-06-16 07:48:49.517550", "logdata": ("PASSWORD": "asdasdas", "USERNAME": "asdjkasjkd"), "logtype": 6001, "node_id": "SynologyDS", "src_host": "127.0.0.1", "src_port": 51768, "utc_time": "2022-06-16 07:48:49.517543")
("dst_host": "127.0.0.1", "dst_port": 23, "honeycred": false, "local_time": "2022-06-16 07:48:55.453303", "local_time_adjusted": "2022-06-16 07:48:55.453339", "logdata": ("PASSWORD": "ssdfds", "USERNAME": "sdfasdf"), "logtype": 6001, "node_id": "SynologyDS", "src_host": "127.0.0.1", "src_port": 51768, "utc_time": "2022-06-16 07:48:55.453332")
("dst_host": "127.0.0.1", "dst_port": 23, "honeycred": false, "local_time": "2022-06-16 07:48:57.876045", "local_time_adjusted": "2022-06-16 07:48:57.876079", "logdata": ("PASSWORD": "sdfdsfs", "USERNAME": "sdfdsf"), "logtype": 6001, "node_id": "SynologyDS", "src_host": "127.0.0.1", "src_port": 51768, "utc_time": "2022-06-16 07:48:57.876073")
("dst_host": "10.0.0.66", "dst_port": "23", "local_time": "2022-06-16 07:51:54.707691", "local_time_adjusted": "2022-06-16 07:51:54.707734", "logdata": ("ID": "19603", "IN": "ens3", "LEN": "40", "MAC": "02:00:17:0d:b9:1c:00:00:17:cf:6a:c2:08:00", "OUT": "", "PREC": "0x00", "PROTO": "TCP", "RES": "0x00", "SYN": "", "TOS": "0x00", "TTL": "55", "URGP": "0", "WINDOW": "18818"), "logtype": 5001, "node_id": "SynologyDS", "src_host": "140.240.250.144", "src_port": "22928", "utc_time": "2022-06-16 07:51:54.707726")
The Regex for each field I want to capture:
^.*dst_port": (.+?), ".*$
^.*local_time": "(.+?)\..*$
^.*PASSWORD": "(.+?)".*$
^.*USERNAME": "(.+?)".*$
^.*src_host": "(.+?)".*$
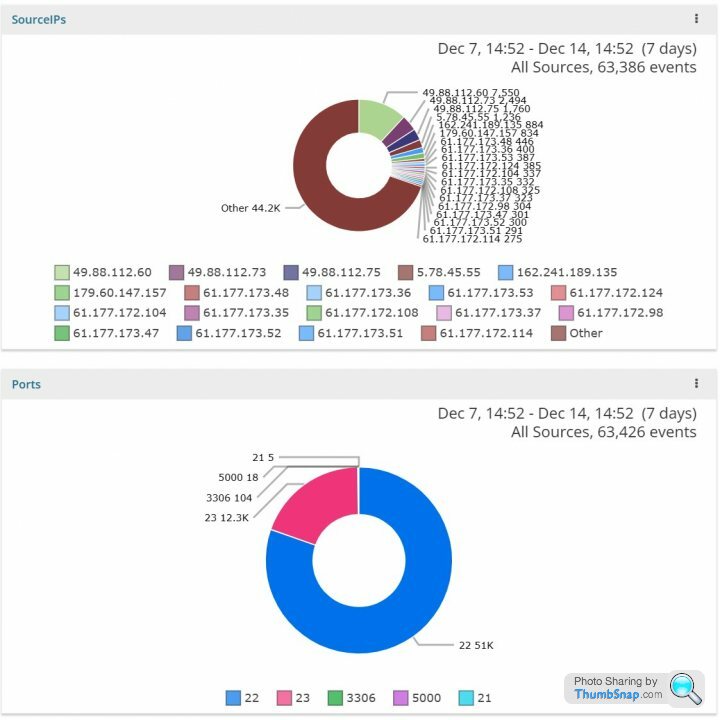
What I am looking for is a free (it’s limited volume) analysis with some pie charts that I can embed into a webpage. I managed to get this from Loggly See image). Does anyone have any ideas as to a solution?
Apologies for the formatting but the code formatting braces don't work well with my log output...
Thanks!
The logs create webhooks with JSON content:
2022-12-11 01:14:51.000
( json: ( message: "("dst_host": "10.0.0.117", "dst_port": 23, "honeycred": false, "local_time": "2022-12-11 00:14:50.102820", "local_time_adjusted": "2022-12-11 00:14:50.102854", "logdata": ("PASSWORD": "abc123", "USERNAME": "admin"), "logtype": 6001, "node_id": "oc-in-oci.ciso.pm", "src_host": "220.132.69.196", "src_port": 39383, "utc_time": "2022-12-11 00:14:50.102848")" ), http: ( clientHost: "129.213.116.221", contentType: "application/x-www-form-urlencoded" ), derived: ( SourceIP: "220.132.69.196", Username: "admin", Port: "23", DateTime: "2022-12-11 00:14:50", Password: "abc123" ) )
2022-12-11 01:14:49.595
( json: ( message: "("dst_host": "10.0.0.117", "dst_port": 22, "local_time": "2022-12-11 00:14:48.800802", "local_time_adjusted": "2022-12-11 00:14:48.800829", "logdata": ("LOCALVERSION": "SSH-2.0-OpenSSH_5.1p1 Debian-4", "PASSWORD": "tcl", "REMOTEVERSION": "SSH-2.0-libssh_0.9.6", "USERNAME": "tcl"), "logtype": 4002, "node_id": "oc-in-oci.ciso.pm", "src_host": "167.71.158.66", "src_port": 35314, "utc_time": "2022-12-11 00:14:48.800822")" ), http: ( clientHost: "129.213.116.221", contentType: "application/x-www-form-urlencoded" ), derived: ( SourceIP: "167.71.158.66", Username: "tcl", Port: "22", DateTime: "2022-12-11 00:14:48", Password: "tcl" ) )
2022-12-11 01:14:48.678
( json: ( message: "("dst_host": "10.0.0.117", "dst_port": 22, "local_time": "2022-12-11 00:14:47.888568", "local_time_adjusted": "2022-12-11 00:14:47.888596", "logdata": ("LOCALVERSION": "SSH-2.0-OpenSSH_5.1p1 Debian-4", "REMOTEVERSION": "SSH-2.0-libssh_0.9.6"), "logtype": 4001, "node_id": "oc-in-oci.ciso.pm", "src_host": "167.71.158.66", "src_port": 35314, "utc_time": "2022-12-11 00:14:47.888590")" ), http: ( clientHost: "129.213.116.221", contentType: "application/x-www-form-urlencoded" ), derived: ( SourceIP: "167.71.158.66", Port: "22", DateTime: "2022-12-11 00:14:47" ) )
2022-12-11 01:14:47.490
( json: ( message: "("dst_host": "10.0.0.117", "dst_port": 22, "local_time": "2022-12-11 00:14:46.611922", "local_time_adjusted": "2022-12-11 00:14:46.611975", "logdata": ("SESSION": "15352"), "logtype": 4000, "node_id": "oc-in-oci.ciso.pm", "src_host": "167.71.158.66", "src_port": 35314, "utc_time": "2022-12-11 00:14:46.611965")" ), http: ( clientHost: "129.213.116.221", contentType: "application/x-www-form-urlencoded" ), derived: ( SourceIP: "167.71.158.66", Port: "22", DateTime: "2022-12-11 00:14:46" ) )
The log file has the following lines.
("dst_host": "127.0.0.1", "dst_port": "51768", "local_time": "2022-06-16 07:48:44.755838", "local_time_adjusted": "2022-06-16 07:48:44.755850", "logdata": ("ACK": "", "DF": "", "ID": "25088", "IN": "lo", "LEN": "52", "MAC": "00:00:00:00:00:00:00:00:00:00:00:00:08:00", "OUT": "", "PREC": "0x00", "PROTO": "TCP", "RES": "0x00", "TOS": "0x00", "TTL": "64", "URGP": "0", "WINDOW": "512"), "logtype": 5001, "node_id": "SynologyDS", "src_host": "127.0.0.1", "src_port": "23", "utc_time": "2022-06-16 07:48:44.755847")
("dst_host": "127.0.0.1", "dst_port": 23, "honeycred": false, "local_time": "2022-06-16 07:48:49.517501", "local_time_adjusted": "2022-06-16 07:48:49.517550", "logdata": ("PASSWORD": "asdasdas", "USERNAME": "asdjkasjkd"), "logtype": 6001, "node_id": "SynologyDS", "src_host": "127.0.0.1", "src_port": 51768, "utc_time": "2022-06-16 07:48:49.517543")
("dst_host": "127.0.0.1", "dst_port": 23, "honeycred": false, "local_time": "2022-06-16 07:48:55.453303", "local_time_adjusted": "2022-06-16 07:48:55.453339", "logdata": ("PASSWORD": "ssdfds", "USERNAME": "sdfasdf"), "logtype": 6001, "node_id": "SynologyDS", "src_host": "127.0.0.1", "src_port": 51768, "utc_time": "2022-06-16 07:48:55.453332")
("dst_host": "127.0.0.1", "dst_port": 23, "honeycred": false, "local_time": "2022-06-16 07:48:57.876045", "local_time_adjusted": "2022-06-16 07:48:57.876079", "logdata": ("PASSWORD": "sdfdsfs", "USERNAME": "sdfdsf"), "logtype": 6001, "node_id": "SynologyDS", "src_host": "127.0.0.1", "src_port": 51768, "utc_time": "2022-06-16 07:48:57.876073")
("dst_host": "10.0.0.66", "dst_port": "23", "local_time": "2022-06-16 07:51:54.707691", "local_time_adjusted": "2022-06-16 07:51:54.707734", "logdata": ("ID": "19603", "IN": "ens3", "LEN": "40", "MAC": "02:00:17:0d:b9:1c:00:00:17:cf:6a:c2:08:00", "OUT": "", "PREC": "0x00", "PROTO": "TCP", "RES": "0x00", "SYN": "", "TOS": "0x00", "TTL": "55", "URGP": "0", "WINDOW": "18818"), "logtype": 5001, "node_id": "SynologyDS", "src_host": "140.240.250.144", "src_port": "22928", "utc_time": "2022-06-16 07:51:54.707726")
The Regex for each field I want to capture:
^.*dst_port": (.+?), ".*$
^.*local_time": "(.+?)\..*$
^.*PASSWORD": "(.+?)".*$
^.*USERNAME": "(.+?)".*$
^.*src_host": "(.+?)".*$
What I am looking for is a free (it’s limited volume) analysis with some pie charts that I can embed into a webpage. I managed to get this from Loggly See image). Does anyone have any ideas as to a solution?
Apologies for the formatting but the code formatting braces don't work well with my log output...
Thanks!
I'm not an expert on this but noticed recently that Grafana have "Loki", a log analytics platform. Website suggests you can create a free account. I imagine it could be tied in with their core visualisation system too.
https://grafana.com/oss/loki/
https://grafana.com/oss/loki/
Gassing Station | Computers, Gadgets & Stuff | Top of Page | What's New | My Stuff