How to calculate frequency and amplitude from a csv file?
Discussion


I have some exported data from my oscilloscope.
It consists of samples of time and voltage (I think) and I would like to calculate the amplitude (pk-pk or rms is fine) and frequency.
If I import the data into Excel, I can recreate the waveform (just a sine wave).
So how can I determine the frequency and amplitude? Is there an easy way, without resorting to Fourier transforms (which are way beyond my ability)?
The data (snippet) looks like this;
The recreated wave form looks like this;
TIA!!
It consists of samples of time and voltage (I think) and I would like to calculate the amplitude (pk-pk or rms is fine) and frequency.
If I import the data into Excel, I can recreate the waveform (just a sine wave).
So how can I determine the frequency and amplitude? Is there an easy way, without resorting to Fourier transforms (which are way beyond my ability)?
The data (snippet) looks like this;
#time voltage
0.000000e+00 1.770000e+02
3.290556e-04 1.280000e+02
6.581112e-04 1.770000e+02
9.871668e-04 1.280000e+02
1.316222e-03 1.770000e+02
1.645278e-03 1.280000e+02
1.974334e-03 1.770000e+02
2.303389e-03 1.280000e+02
2.632445e-03 1.770000e+02
2.961500e-03 1.280000e+02
3.290556e-03 1.760000e+02
3.619612e-03 1.280000e+02
3.948667e-03 1.770000e+02
4.277723e-03 1.280000e+02
4.606779e-03 1.770000e+02
4.935834e-03 1.280000e+02
5.264890e-03 1.770000e+02
5.593945e-03 1.280000e+02
5.923001e-03 1.760000e+02
6.252057e-03 1.280000e+02
6.581112e-03 1.770000e+02
6.910168e-03 1.280000e+02
7.239223e-03 1.770000e+02
<SNIP>
The recreated wave form looks like this;
TIA!!
How accurate do you want it?
firstly, you should plot as x-y to get the time base on the axis.
With the limited data set you've sent and the fact you've not plotted the x-values makes it hard to answer. The data you've posted also either suffers from aliasing or is a very low sample speed that's nearly in sync with your fundamental....
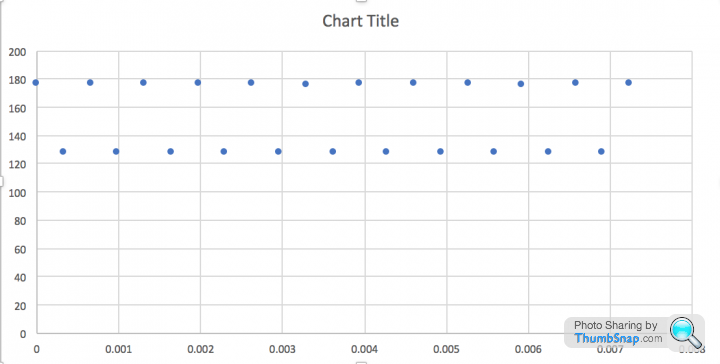
Your amplitude is quite easy to guesstimate, mean is about 130, and peak is 175, so amplitude is about 45.
Frequency I could guess at, but best for you to upload a full x-y plot to read period off properly
Frequency = 1/ period.
At the moment your period is in Samlples, not seconds (As it would be on an X-y plot as I've uploaded)
Using your figure we can see that in samples;
Time for a full cycle - ie. the time from 875 samples to 2725 samples - circa 2000 samples -> frequency 1/period -> 2KSamples.
So if you re: plot with time base and do the above you'll get the frequency you're after. You should be able to measure amplitude and frequency pretty accurately (say within 1%) with the data you;ve got - I'm a little unsure what your snippet of data was though, it's not clean / there is higher order harmonic.
HTH,
stu
firstly, you should plot as x-y to get the time base on the axis.
With the limited data set you've sent and the fact you've not plotted the x-values makes it hard to answer. The data you've posted also either suffers from aliasing or is a very low sample speed that's nearly in sync with your fundamental....
Your amplitude is quite easy to guesstimate, mean is about 130, and peak is 175, so amplitude is about 45.
Frequency I could guess at, but best for you to upload a full x-y plot to read period off properly
Frequency = 1/ period.
At the moment your period is in Samlples, not seconds (As it would be on an X-y plot as I've uploaded)
Using your figure we can see that in samples;
Time for a full cycle - ie. the time from 875 samples to 2725 samples - circa 2000 samples -> frequency 1/period -> 2KSamples.
So if you re: plot with time base and do the above you'll get the frequency you're after. You should be able to measure amplitude and frequency pretty accurately (say within 1%) with the data you;ve got - I'm a little unsure what your snippet of data was though, it's not clean / there is higher order harmonic.
HTH,
stu
stuthe said:
said:
said: Helpful stuff!
stu
Stu - thanks for that.stu
I would like it to be as accurate as possible.
stuthe said:
said: firstly, you should plot as x-y to get the time base on the axis.
I thought I was already plotting the x-y data? Sorry, but I failed badly at maths at school 40 odd years ago!I have upload a sample CSV file to my web hosting - it can be downloaded here - I have added the .txt extension so it just renders in the browser as text instead of downloading.
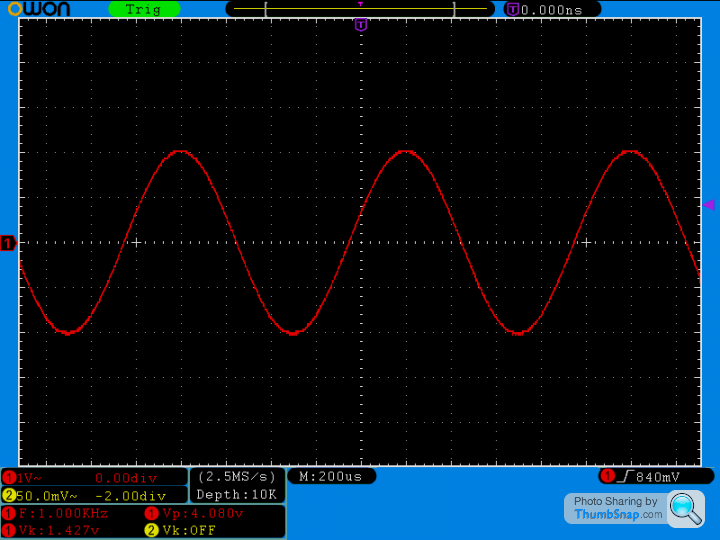
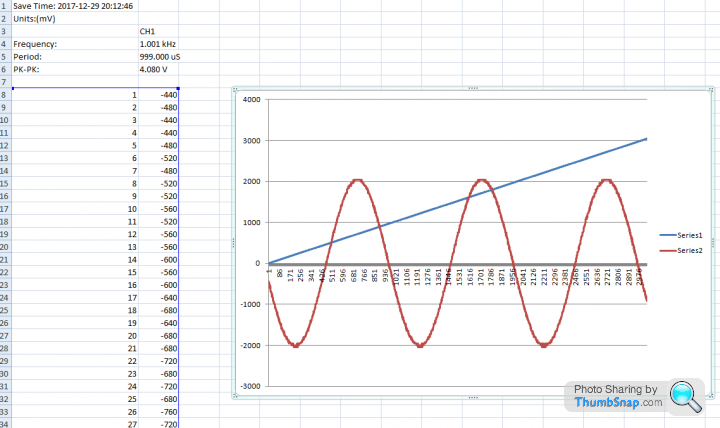
This is a screenshot of the oscilloscope screen displaying the waveform the CSV was captured from.
In the screenshot, 'Vk' is Volts RMS, 'Vp' is Volts pk to pk.
Excel recreates the data like this:
Thanks!
Edited by TonyRPH on Friday 29th December 19:55
Edited by TonyRPH on Friday 29th December 19:56
It's interesting you say that - I'm using some 3rd party developed tools to extract the data via Linux scripts.
If I export the data directly from the Owon 'scope application (which unfortunately does not support scripting otherwise...) the CSV data I get looks like this (again renamed to .txt to ensure it renders as plain text in the browser).
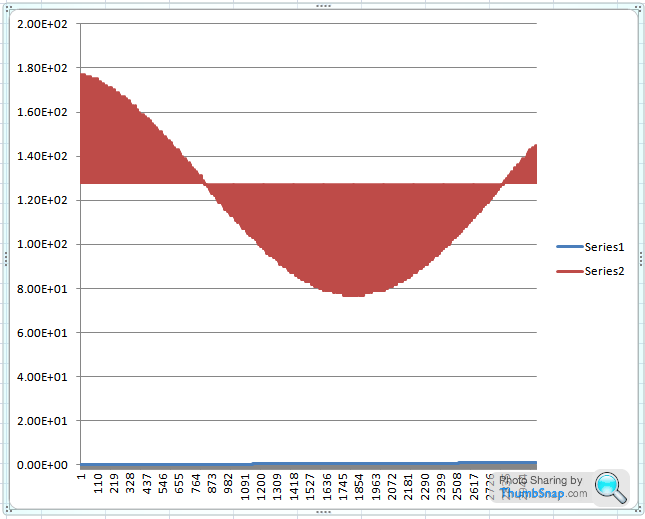
The resulting wave form in Excel looks somewhat different too (and a perfect reproduction of what's seen on screen) - although I'm also not sure what the odd grey / blue line is!
If I export the data directly from the Owon 'scope application (which unfortunately does not support scripting otherwise...) the CSV data I get looks like this (again renamed to .txt to ensure it renders as plain text in the browser).
The resulting wave form in Excel looks somewhat different too (and a perfect reproduction of what's seen on screen) - although I'm also not sure what the odd grey / blue line is!
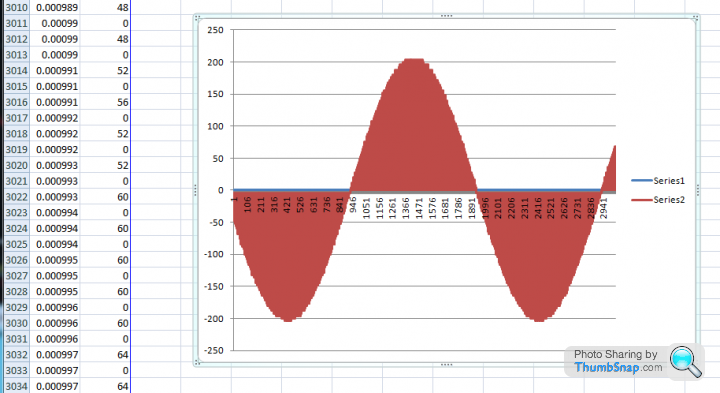
Yeah, something is up. The amplitude is very different.
Skipping every other line and realigning to zoom into a single cycle (with the data set you sent this is fair enough, although not highly accurate as a single cycle will have error - better to average over 10 or 100 if it's a fixed freq you're measuring.
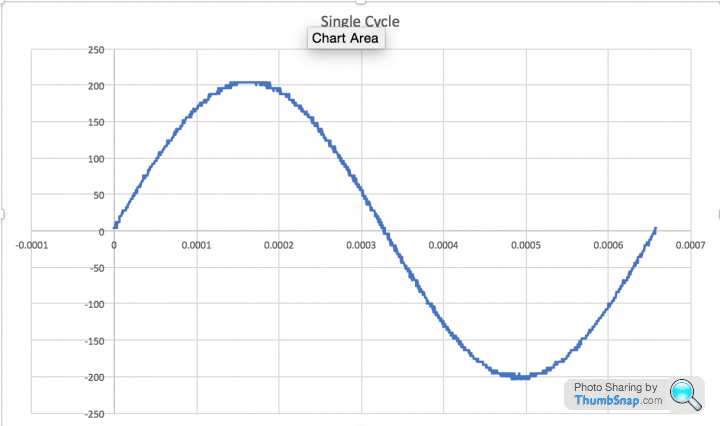
So based on what you uploaded, pk-pk amplitude of circa 405 (whatevers, big diff between this data and your scope) and a freq of 1/0.000657 = 1520 Hz.
HTH
Skipping every other line and realigning to zoom into a single cycle (with the data set you sent this is fair enough, although not highly accurate as a single cycle will have error - better to average over 10 or 100 if it's a fixed freq you're measuring.
So based on what you uploaded, pk-pk amplitude of circa 405 (whatevers, big diff between this data and your scope) and a freq of 1/0.000657 = 1520 Hz.
HTH
stuthe said:
said: Yeah, something is up. The amplitude is very different.
<snip>
So based on what you uploaded, pk-pk amplitude of circa 405 (whatevers, big diff between this data and your scope) and a freq of 1/0.000657 = 1520 Hz.
HTH
Wow, the frequency is very different... ~500Hz is quite an error! The 405 - I guess that could be just down to decimal places as the pk - pk V is currently 4.08, so 4.08... 4.05... not bad. There are obviously timebase issues in the scripts.<snip>
So based on what you uploaded, pk-pk amplitude of circa 405 (whatevers, big diff between this data and your scope) and a freq of 1/0.000657 = 1520 Hz.
HTH
Anyway - it looks as though the scripts I have are returning false data so I'll need to see if I can somehow hack those first.
Thanks so much for your help - it's really appreciated.
I don't trust any of these axis to be honest, you need to work out what they should be.
The blue line in excel is you're not plotting an X-Y - you've fallen into the classic trap of plotting a double series. Excel thinks you're plotting two series, one in column a (which just happens to be counting up) and another in column B (your data). You need to graph an X-Y plot. Google it. What you have there is a double series plot and that's the funny blue line.
Beyond that your export is funny. These things don't agree.
That said, I think the header in your excel screen grab is probably what you're after.
I'd wager the 4.08V Pk-Pk is correct, as is the 1KHz frequency. I think they scope has done the FFT for you there.
To work it out yourself you need to know how many volts correlate to the Y-data, and how many seconds correlate to your x-data. Without that we're just guessing.
What were you measuring, what were you expecting?
OK, your Owan data is the best place to start. Forget the linux output stuff IMO, that's gumpf.
What Owan tells you for sure is that the ok-pk is 4.08Volts.
It tells us in the header units are in mv, and the pk-pk readings are -+2040 = -+2.04V = 4.08V pk-pk. Done.
Now I can infer, but really this isn't highly certain, from pattern matching in your Owan header, that you're sampling at 1.001KHz. Data point 1 is 1/1001 seconds, data point 2 is at 2/1001 seconds etc...
If that's the case, and I'm sorry i gotta bounce, but I'd put your frequency at around 1Hz based on the fact that on your plot you have 2 full cycles from sample 426 to sample 2468 = circa 2000 samples difference. Which means you're about 1000 samples per full waveform, andiIf we assume you're sampling at 1KHz, then it's 1 second per cycle, or a frequency of 1Hz.
stuthe said:
said: That said, I think the header in your excel screen grab is probably what you're after.
That's exactly what I'm after, but sadly the Owon software needs user interaction to export the CSV data, hence I'm trying to script it in Linux.stuthe said:
said: I'd wager the 4.08V Pk-Pk is correct, as is the 1KHz frequency. I think they scope has done the FFT for you there.
That data is spot on, it's the scope software that's doing the FFT as I understand it.stuthe said:
said: To work it out yourself you need to know how many volts correlate to the Y-data, and how many seconds correlate to your x-data. Without that we're just guessing.
What were you measuring, what were you expecting?
This was just a static 1kHz tone generated by an audio oscillator - my intended application is audio testing.What were you measuring, what were you expecting?
stuthe said:
said: yeah you need to workout how your linux script is creating a different timebase and why it's (apparently) dividing y by 10!
Indeed - I have a choice of learning more about Python or C++ haha!stuthe said:
said: OK, your Owan data is the best place to start. Forget the linux output stuff IMO, that's gumpf.
What Owan tells you for sure is that the ok-pk is 4.08Volts.
It tells us in the header units are in mv, and the pk-pk readings are -+2040 = -+2.04V = 4.08V pk-pk. Done.
Now I can infer, but really this isn't highly certain, from pattern matching in your Owan header, that you're sampling at 1.001KHz. Data point 1 is 1/1001 seconds, data point 2 is at 2/1001 seconds etc...
If that's the case, and I'm sorry i gotta bounce, but I'd put your frequency at around 1Hz based on the fact that on your plot you have 2 full cycles from sample 426 to sample 2468 = circa 2000 samples difference. Which means you're about 1000 samples per full waveform, andiIf we assume you're sampling at 1KHz, then it's 1 second per cycle, or a frequency of 1Hz.
Completely agree that the Owon data is correct (as I'd hope it would be!)What Owan tells you for sure is that the ok-pk is 4.08Volts.
It tells us in the header units are in mv, and the pk-pk readings are -+2040 = -+2.04V = 4.08V pk-pk. Done.
Now I can infer, but really this isn't highly certain, from pattern matching in your Owan header, that you're sampling at 1.001KHz. Data point 1 is 1/1001 seconds, data point 2 is at 2/1001 seconds etc...
If that's the case, and I'm sorry i gotta bounce, but I'd put your frequency at around 1Hz based on the fact that on your plot you have 2 full cycles from sample 426 to sample 2468 = circa 2000 samples difference. Which means you're about 1000 samples per full waveform, andiIf we assume you're sampling at 1KHz, then it's 1 second per cycle, or a frequency of 1Hz.
I think the sampling rate is higher (scope states 2.5MS/s in the data screen) - but I suspect you're referring to the sampling rate of the script?
stuthe said:
said: This in an o2 sensor isn't it?
If so, it's working properly. Full cycle circa 1 Hz.
Nope! As stated above it's an audio testing application. If so, it's working properly. Full cycle circa 1 Hz.

Thanks again for your help.

Scripting, 'scopes and Excel are not your 1st languages are they?!
But there's only one way to learn and that's to do it.
One of my colleagues is a whizz with scripting so I let him read the runes and wave the wand so I can't help there but 'scopes and to some extent Excel are up my street - electronics eng.
As others have said while the scripting output looks friendly with outputs in (allegedly) real time & voltage the numbers do not stack up with what the scope is telling you.
So as others have done I'll ignore the script produced data.
The 'scope screencap you show says (and apologies for potential grandparent egg-sucking tutorial)
the setup is:
y axis 1V per division
x axis 200us per division
sample rate 2.5Mbits per second
no. of samples available 10000
and there is some signal measurement data:
frequency 1kHz
peak to peak voltage 4.08V
The screen is 15 divisions wide so showing 3ms of data.
You've told us your signal is 1kHz or 1ms period (p=1/f) so stuff ties up so far my, eye/brain both say there's about three whole 1kHz cycles in 3ms.
Do you also know what the signal generator output voltage should be? To check the voltage the 'scope is showing.
Let's assume it's right.
There are about 4 divisions in height between the peaks and troughs so that looks good for about 4V.
Now to consider the 'scope data file.
Looks like you're getting 3000 samples in this file and the data is looking like the scope picture (or thereabouts) when plotted.
The bit you're missing is the sample interval of the data points in the file. i.e. how many time units between each point.
Where time stamps for each point are not included there's usually other data available from the 'scope. Called a header, maybe, which will tell you this but I think I can work it out.
It's not unusual for the data sampled by the scope to be both longer (as if for a much wider screen) and at a higher sample rate (as if for a screen with many, many more pixels) than that displayed AND that output in a datafile. This allows zoom-in on bits of the waveform post-capture. The datafile contents can often be specified too. RTFM should have chapter and (probably obtuse) verse on this.
With a sample rate of 2.5Mbits/s and 10k samples I'd expect there to be 4ms of data available.
Or for a screen width of 3ms 7500 samples to be available.
In this case while the datafile looks to be the same length of data displayed on the screen it is 3040 samples(! what a helpful timebase. Not.). Both of these are subsets of what's been captured.
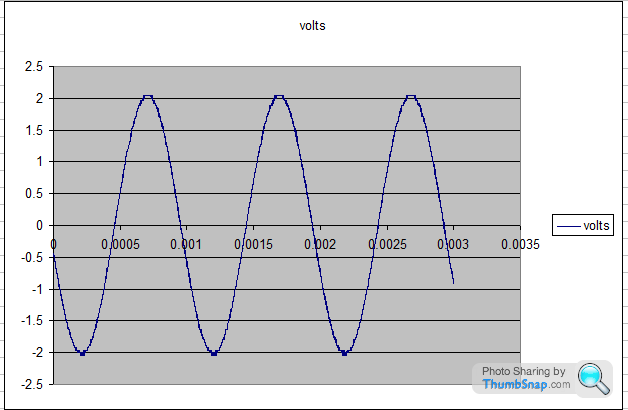
If I assume that exactly 3ms of data is in the datafile the sample interval is 0.987us per sample (3ms/3040).
Phew!
I regenerated a timebase based on this and plotted volts as sample value/1000 and hey presto:
If you'll accept a personal email I can send my Excel workings.
I don't know whether then using this data for your purposes will be accurate enough. The 'scope measurements only give a couple of sig. figs, is this enough? You'd need to pick two points in exactly the same part of the cycle (e.g. peak to peak) in the data and subtract the timestamps. This gives the period.
But there's only one way to learn and that's to do it.
One of my colleagues is a whizz with scripting so I let him read the runes and wave the wand so I can't help there but 'scopes and to some extent Excel are up my street - electronics eng.
As others have said while the scripting output looks friendly with outputs in (allegedly) real time & voltage the numbers do not stack up with what the scope is telling you.
So as others have done I'll ignore the script produced data.
The 'scope screencap you show says (and apologies for potential grandparent egg-sucking tutorial)
the setup is:
y axis 1V per division
x axis 200us per division
sample rate 2.5Mbits per second
no. of samples available 10000
and there is some signal measurement data:
frequency 1kHz
peak to peak voltage 4.08V
The screen is 15 divisions wide so showing 3ms of data.
You've told us your signal is 1kHz or 1ms period (p=1/f) so stuff ties up so far my, eye/brain both say there's about three whole 1kHz cycles in 3ms.
Do you also know what the signal generator output voltage should be? To check the voltage the 'scope is showing.
Let's assume it's right.
There are about 4 divisions in height between the peaks and troughs so that looks good for about 4V.
Now to consider the 'scope data file.
Looks like you're getting 3000 samples in this file and the data is looking like the scope picture (or thereabouts) when plotted.
The bit you're missing is the sample interval of the data points in the file. i.e. how many time units between each point.
Where time stamps for each point are not included there's usually other data available from the 'scope. Called a header, maybe, which will tell you this but I think I can work it out.
It's not unusual for the data sampled by the scope to be both longer (as if for a much wider screen) and at a higher sample rate (as if for a screen with many, many more pixels) than that displayed AND that output in a datafile. This allows zoom-in on bits of the waveform post-capture. The datafile contents can often be specified too. RTFM should have chapter and (probably obtuse) verse on this.
With a sample rate of 2.5Mbits/s and 10k samples I'd expect there to be 4ms of data available.
Or for a screen width of 3ms 7500 samples to be available.
In this case while the datafile looks to be the same length of data displayed on the screen it is 3040 samples(! what a helpful timebase. Not.). Both of these are subsets of what's been captured.
If I assume that exactly 3ms of data is in the datafile the sample interval is 0.987us per sample (3ms/3040).
Phew!
I regenerated a timebase based on this and plotted volts as sample value/1000 and hey presto:
If you'll accept a personal email I can send my Excel workings.
I don't know whether then using this data for your purposes will be accurate enough. The 'scope measurements only give a couple of sig. figs, is this enough? You'd need to pick two points in exactly the same part of the cycle (e.g. peak to peak) in the data and subtract the timestamps. This gives the period.
jet_noise said:
Scripting, 'scopes and Excel are not your 1st languages are they?!
Bash scripting and php yes, a bit of Python - but I'm using some C++ stuff to extract the data from the scope, and I simply don't fully understand what the code is doing.I also tried a Python script (but this only parses the bin file as extracted form the 'scope, and that simply doesn't work with my .bin files.
jet_noise said:
The 'scope screencap you show says (and apologies for potential grandparent egg-sucking tutorial)
the setup is:
y axis 1V per division
x axis 200us per division
sample rate 2.5Mbits per second
no. of samples available 10000
and there is some signal measurement data:
frequency 1kHz
peak to peak voltage 4.08V
The screen is 15 divisions wide so showing 3ms of data.
You've told us your signal is 1kHz or 1ms period (p=1/f) so stuff ties up so far my, eye/brain both say there's about three whole 1kHz cycles in 3ms.
Do you also know what the signal generator output voltage should be? To check the voltage the 'scope is showing.
Let's assume it's right.
Signal genny output has been checked with a millivoltmeter and it's spot on.the setup is:
y axis 1V per division
x axis 200us per division
sample rate 2.5Mbits per second
no. of samples available 10000
and there is some signal measurement data:
frequency 1kHz
peak to peak voltage 4.08V
The screen is 15 divisions wide so showing 3ms of data.
You've told us your signal is 1kHz or 1ms period (p=1/f) so stuff ties up so far my, eye/brain both say there's about three whole 1kHz cycles in 3ms.
Do you also know what the signal generator output voltage should be? To check the voltage the 'scope is showing.
Let's assume it's right.
jet_noise said:
There are about 4 divisions in height between the peaks and troughs so that looks good for about 4V.
Now to consider the 'scope data file.
Looks like you're getting 3000 samples in this file and the data is looking like the scope picture (or thereabouts) when plotted.
The bit you're missing is the sample interval of the data points in the file. i.e. how many time units between each point.
Where time stamps for each point are not included there's usually other data available from the 'scope. Called a header, maybe, which will tell you this but I think I can work it out.
It's not unusual for the data sampled by the scope to be both longer (as if for a much wider screen) and at a higher sample rate (as if for a screen with many, many more pixels) than that displayed AND that output in a datafile. This allows zoom-in on bits of the waveform post-capture. The datafile contents can often be specified too. RTFM should have chapter and (probably obtuse) verse on this.
I think I mentioned something about sample rates in one of my previous posts. Unfortunately the tools I'm using do not provide the header info.Now to consider the 'scope data file.
Looks like you're getting 3000 samples in this file and the data is looking like the scope picture (or thereabouts) when plotted.
The bit you're missing is the sample interval of the data points in the file. i.e. how many time units between each point.
Where time stamps for each point are not included there's usually other data available from the 'scope. Called a header, maybe, which will tell you this but I think I can work it out.
It's not unusual for the data sampled by the scope to be both longer (as if for a much wider screen) and at a higher sample rate (as if for a screen with many, many more pixels) than that displayed AND that output in a datafile. This allows zoom-in on bits of the waveform post-capture. The datafile contents can often be specified too. RTFM should have chapter and (probably obtuse) verse on this.
jet_noise said:
With a sample rate of 2.5Mbits/s and 10k samples I'd expect there to be 4ms of data available.
Or for a screen width of 3ms 7500 samples to be available.
In this case while the datafile looks to be the same length of data displayed on the screen it is 3040 samples(! what a helpful timebase. Not.). Both of these are subsets of what's been captured.
If I assume that exactly 3ms of data is in the datafile the sample interval is 0.987us per sample (3ms/3040).
Phew!
I regenerated a timebase based on this and plotted volts as sample value/1000 and hey presto:
If you'll accept a personal email I can send my Excel workings.
I don't know whether then using this data for your purposes will be accurate enough. The 'scope measurements only give a couple of sig. figs, is this enough? You'd need to pick two points in exactly the same part of the cycle (e.g. peak to peak) in the data and subtract the timestamps. This gives the period.
Thanks, PM sent!Or for a screen width of 3ms 7500 samples to be available.
In this case while the datafile looks to be the same length of data displayed on the screen it is 3040 samples(! what a helpful timebase. Not.). Both of these are subsets of what's been captured.
If I assume that exactly 3ms of data is in the datafile the sample interval is 0.987us per sample (3ms/3040).
Phew!
I regenerated a timebase based on this and plotted volts as sample value/1000 and hey presto:
If you'll accept a personal email I can send my Excel workings.
I don't know whether then using this data for your purposes will be accurate enough. The 'scope measurements only give a couple of sig. figs, is this enough? You'd need to pick two points in exactly the same part of the cycle (e.g. peak to peak) in the data and subtract the timestamps. This gives the period.

I've responded directly by email, I hope it makes sense.
Spreadsheets are not the most clear way of understanding!
One thing I am already querying is my assumption of 3ms is 3040 samples.
If your sig. gen. frequency is known to be accurate (and the scope seems to suggest that it is).
Look at the point the capture ends vs where it starts. Looks like you've got a smidge more than 3 whole cycles.
You really need that header information or a detailed manual to get the most accurate results.
There is a manual that accompanies the 'scope, however it's not the best.
It's only a budget 'scope after all (Owon SDS5032E).
I wish I had known about the software limitations when I bought it, as it would seem that the Rigol has a more open API making it easier to write apps for it.
I also have a Velleman USB scope, and although that offers access to an API via a DLL, it's functionality is severely limited.
TonyRPH said:
Just to add...
Regarding my oscillator - it's an AD9850 driven by an Arduino - so fairly confident it's accurate!
It's only as good as it's clock source!Regarding my oscillator - it's an AD9850 driven by an Arduino - so fairly confident it's accurate!
Assuming you're using one of the standard ebay AD9850 modules, they usually come with a basic (uncontrolled) quartz crystal as the clock. These are pretty poor in the grand scheme of things for absolute accuracy, and are affected by numerous factors (temperature, orientation, static charge etc)
Of course, we don't know how good the clock in your scope is either! (likely to be pretty poor, definitely worth turning on an leaving to warm up for a bit (30min) before doing any measurements)
Max_Torque said:
It's only as good as it's clock source!
Assuming you're using one of the standard ebay AD9850 modules, they usually come with a basic (uncontrolled) quartz crystal as the clock. These are pretty poor in the grand scheme of things for absolute accuracy, and are affected by numerous factors (temperature, orientation, static charge etc)
Of course, we don't know how good the clock in your scope is either! (likely to be pretty poor, definitely worth turning on an leaving to warm up for a bit (30min) before doing any measurements)
Yes absolutely on both counts (no pun intended).Assuming you're using one of the standard ebay AD9850 modules, they usually come with a basic (uncontrolled) quartz crystal as the clock. These are pretty poor in the grand scheme of things for absolute accuracy, and are affected by numerous factors (temperature, orientation, static charge etc)
Of course, we don't know how good the clock in your scope is either! (likely to be pretty poor, definitely worth turning on an leaving to warm up for a bit (30min) before doing any measurements)
It is indeed one of the standard modules.
Fortunately I'm only working up to 1 MHz so I suspect the clock accuracy is not a huge issue for me.
Gassing Station | Science! | Top of Page | What's New | My Stuff