Life expectancy
Discussion


Camoradi said:
I wonder what has happened to cause such a fast decline in the last 3 years....
The collateral damage will be with us for many years. Friend's daughter just diagnosed with GAD, she's only eleven and should be having the time of her life, instead of which she's frightened of most things and can't function at school. Anyone who didn't foresee this happening deserves flogging. 
Gecko1978 said:
Is the UKs not in the 80s.......
81 or so.Rivenink said:
Might be their dysfunctional, profiteering healthcare system.
People there do not go to the doctor or hospital until it is too late.
Possibly. People there do not go to the doctor or hospital until it is too late.
When outcomes are considered on healthcare systems, I think this is probably one of the ultimate ones
But other figures do apply (look across the European life expectancy figures versus perceptions on quality of healthcare....Though what those figures don't/cannot express is "quality of life". Not much point living to 100 if you can do nothing but dribble...
cgt2 said:
A lot of obese people and in general very poor dietary regime, even everyday foods packed with nasty additives.
Not surprising.
For a while population reduction has been discussed, even good old David Attenborough has been a protagonist.Not surprising.
Would it be climate change, natural disaster, epidemic, man made, sudden or evolutionary? Or is it a case of what goes around comes around.
Edited by PositronicRay on Tuesday 18th October 15:54
Remember the most sensitive factor for life expectancy is infant mortality. The US is terrible at it for the vulnerable because of the way their healthcare/support networks work, so they've got to work against that with their.....terrible murder rate, Type 2 diabetes, obesity, junk food....oh.
GroundEffect said:
Remember the most sensitive factor for life expectancy is infant mortality. The US is terrible at it for the vulnerable because of the way their healthcare/support networks work, so they've got to work against that with their.....terrible murder rate, Type 2 diabetes, obesity, junk food....oh.
On the other hand very good health care for those well insured means that what might be stillbirths in other countries often turn into infant mortality.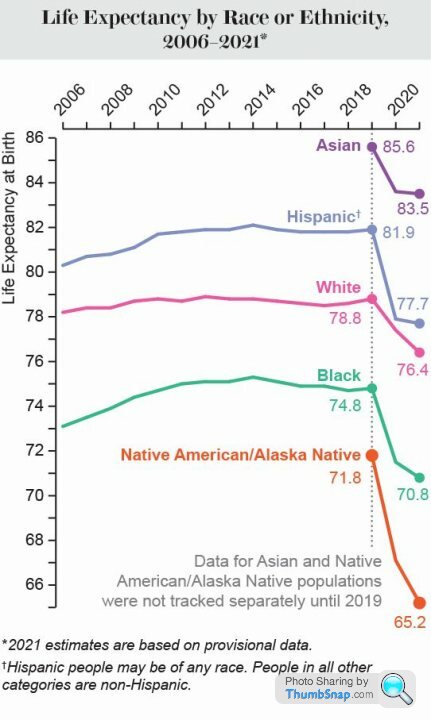
smn159 said:
cgt2 said:
A lot of obese people and in general very poor dietary regime, even everyday foods packed with nasty additives.
Not surprising.
I was over there recently and went to a baseball game and looked for something to eat. Not surprising.
Surprised that I made it out alive TBH


Uk figures as at 2014 shown below.
source is https://www.ons.gov.uk/peoplepopulationandcommunit...
Yes, I'm aware it's badly formatted, but still legible.
Table 1: Life expectancy at birth by sex and ethnic group: England and Wales 2011 to 2014
Ethnic group Females Males Sex gap
(years)
Asian
other 86.9 84.5 2.4
Bangladeshi 87.3 81.1 6.2
Black
African 88.9 83.8 5.1
Black
Caribbean 84.6 80.7 3.9
Black
other 86.8 82.0 4.8
Indian 85.4 82.3 3.1
Mixed 83.1 79.3 3.8
Other 86.9 84.0 2.9
Pakistani 84.8 82.3 2.5
White 83.1 79.7 3.4
Ethnic group
gap (years) 5.8 5.2
Source: Office for National Statisitcs
Notes
Gecko1978 said:
Camoradi said:
I wonder what has happened to cause such a fast decline in the last 3 years....
Lol....errr still Native Americans it's 60s which is not great maybe ask why they live shortest lives (I think it's alcoholism)The figures graph shows another frightening issue, which is part of the problem. Well, the notation on the graph. Until 2019 Asian and native Americans were not counted separately…
Covid knocked a chunk off the averages across the globe.
For those getting nervous, this isn't a bad calculator, you can "scroll" up and down your results to see your chances of reaching a certain age. 50% chance of making it to 87, me
https://www.blueprintincome.com/tools/life-expecta...
(not a site that flogs your info, asks for emails or any of that s te) Probably based on US demographics though.
M.
For those getting nervous, this isn't a bad calculator, you can "scroll" up and down your results to see your chances of reaching a certain age. 50% chance of making it to 87, me
https://www.blueprintincome.com/tools/life-expecta...
(not a site that flogs your info, asks for emails or any of that s
te) Probably based on US demographics though.M.
Gassing Station | News, Politics & Economics | Top of Page | What's New | My Stuff