Climate change - the POLITICAL debate (Vol 7)
Discussion


mike9009 said:
Are averages pointless?? Discuss....
Here's the BBC's take on the real issue; their faith in tree rings is akin to reading tea leaves to predict future climaggedon: "Researchers say the tree ring information is a huge addition to what we know about our changing climate over history.
Even in the 1850-1900 period, there were only 58 weather stations recording temperatures around the world, with 45 of them in Europe..
 You couldn't make it up, but it's actuality!
The consequence is temperatures during this period may actually have been overestimated, because of the way in which these measurements were taken.
The new study suggests this means that the world may have actually warmed around a quarter of a degree more than typically reported."
The BBC doesn't see the irony or the comical nature of their assertions; their faith in voodoo is unshakable even in the face of logic and epistemologically unsound assumptions. How are those averages looking now? 58 weather stations across a global land area of 510.1 million sq Kms. Can you not see an issue with this? Really?
Here's the link in case you want a laugh:
https://www.bbc.co.uk/news/articles/c72pp3yqzjyo#:...
Diderot said:
mike9009 said:
Are averages pointless?? Discuss....
Here's the BBC's take on the real issue; their faith in tree rings is akin to reading tea leaves to predict future climaggedon: "Researchers say the tree ring information is a huge addition to what we know about our changing climate over history.
Even in the 1850-1900 period, there were only 58 weather stations recording temperatures around the world, with 45 of them in Europe..
You couldn't make it up, but it's actuality!The consequence is temperatures during this period may actually have been overestimated, because of the way in which these measurements were taken.
The new study suggests this means that the world may have actually warmed around a quarter of a degree more than typically reported."
The BBC doesn't see the irony or the comical nature of their assertions; their faith in voodoo is unshakable even in the face of logic and epistemologically unsound assumptions. How are those averages looking now? 58 weather stations across a global land area of 510.1 million sq Kms. Can you not see an issue with this? Really?
Here's the link in case you want a laugh:
https://www.bbc.co.uk/news/articles/c72pp3yqzjyo#:...
The consequence is temperatures during this period may actually have been overestimated, because of the way in which these measurements were taken.
Notice the word 'may'.... May, may, may, may not definitely!

'May' is all anyone could say; like 'likely' - even though each of those statements are pissing in the wind, fantasy land.
Address the real issue: only 58 weather stations between 1850-1900, 45 in Europe, and 510million km sq to cover. If you can't see an issue with that, then you need to enlist Specsavers. It's utterly hilarious
Address the real issue: only 58 weather stations between 1850-1900, 45 in Europe, and 510million km sq to cover. If you can't see an issue with that, then you need to enlist Specsavers. It's utterly hilarious
Diderot said:
'May' is all anyone could say; like 'likely' - even though each of those statements are pissing in the wind, fantasy land.
Address the real issue: only 58 weather stations between 1850-1900, 45 in Europe, and 510million km sq to cover. If you can't see an issue with that, then you need to enlist Specsavers. It's utterly hilarious
Needs to be in the science thread really. But I don't see why you cannot look for trends in one geographic location from 1850 to date? Address the real issue: only 58 weather stations between 1850-1900, 45 in Europe, and 510million km sq to cover. If you can't see an issue with that, then you need to enlist Specsavers. It's utterly hilarious
Then one can reverse extrapolate wider based on the wider distribution of data recorded in later years. Obviously it assumes the same global trends over the last two hundred years.....but we seem to go back millions of years using a globally accepted average temp.
Not seen data for the UK specifically in 10,200,000 BC scientifically presented yet.....so some extrapolation must have been applied to present the global trend data over the millions of years. The dataset is oft used to demonstrate climate change has always occurred. So why not question that dataset too?? No need to answer that, I know why.
I don't think that it is beyond the wit of man.
Or alternatively we could base climatic trends on the number of days Graham from Doncaster has had his heating on each month. But a little skeptical as this might involve averaging which is pretty hopeless.
Edited by mike9009 on Saturday 15th June 23:05
turbobloke said:
Randy Winkman said:
robinessex said:
durbster said:
If somebody told robinessex that a sandwich was highly likely to give him severe food poisoning, he would see no reason not to eat it
Oh dear Durbs is desperate again. Having been told "a sandwich was highly likely to give me severe food poisoning", I presume/ expect the remark would've been preceded by some factual evidence.Nelson and Nelson (2024) in "Decoupling CO2 from Climate Change" added to the increasing number of papers demonstrating the inabiity of carbon dioxide to have any significant let alone dangerous effect on temperature.
Cannell 2024 dismissed the claimed primacy of carbon dioxide levels, which cannot explain periods where the planet entered an ice age with high and rising CO2 levels nor times when there were high CO2 levels but with oceans not acidifying, while previously dismissed pressure changes do provide a satisfactory explanation for both, also pointing out corresponsdng errors in climate modelling relating to nitrogen levels...in more detail:
-atmospheric pressure has varied more in the geological past than previously thought, with pressure variation linked to temperature which is not driven by CO2 levels
-climate models assume a constant mass of atmospheric nitrogen even though there is no basis in evidence for this
-changes in pressure can explain past hot-house and ice-house episodes which ran contrary to carbon dioxide levels
-e.g. high and rising CO2 going into and through an ice age...
-...and periods of high atmospheric CO2 with non-acidic oceans...
-...giving a more accurate and complete picture where CO2 is not the controlling factor for planetary temperature...
-...in addition to atmospheric CO2 levels not beingthe determinant of ocean pH, nor is CO2 the determinant of global temperature
Kato and Rose 2024 showed that absorbed shortwave has gone up since 2000 at +0.68 W/m² per decade which explains the top of atmosphere (TOA) energy imbalance (increase) as well as the surface imbalance
Ollila 2023 noted "these results mean that there is no climate crisis"
Koutsoyiannis and Vournas 2023 found from downwelling longwave observations over 100 years that carbon dioxide level increasing from 300 ppmv to 400 ppmv resulted in no discernible alteration to the greenhouse effect
Dagsvik and Moen 2023 found that the effect of manmade CO2 emissions is nosufficient to cause systematic temperature fluctuations
Fleming 2018 confirmed that there is no propensity for carbon dioxide to trap and store heat over time to produce a climate change effect
Fleming 2018 also noted that empirical data point to the extreme value of carbon dioxide to life, with no role in any significant climate change
This collection of objectivity based on data makes a mockery of gov't policy and renders consideration of IPCC faithful forecasting absolutely pointless.
mike9009 said:
Diderot said:
'May' is all anyone could say; like 'likely' - even though each of those statements are pissing in the wind, fantasy land.
Address the real issue: only 58 weather stations between 1850-1900, 45 in Europe, and 510million km sq to cover. If you can't see an issue with that, then you need to enlist Specsavers. It's utterly hilarious
Needs to be in the science thread really. But I don't see why you cannot look for trends in one geographic location from 1850 to date? Address the real issue: only 58 weather stations between 1850-1900, 45 in Europe, and 510million km sq to cover. If you can't see an issue with that, then you need to enlist Specsavers. It's utterly hilarious
Then one can reverse extrapolate wider based on the wider distribution of data recorded in later years. Obviously it assumes the same global trends over the last two hundred years.....but we seem to go back millions of years using a globally accepted average temp.
Not seen data for the UK specifically in 10,200,000 BC scientifically presented yet.....so some extrapolation must have been applied to present the global trend data over the millions of years. The dataset is oft used to demonstrate climate change has always occurred. So why not question that dataset too?? No need to answer that, I know why.
I don't think that it is beyond the wit of man.
Or alternatively we could base climatic trends on the number of days Graham from Doncaster has had his heating on each month. But a little skeptical as this might involve averaging which is pretty hopeless.
Edited by mike9009 on Saturday 15th June 23:05
In its basic form we are looking at weather and wind direction, as we are seeing now, wind blowing from the north gives us cooler temperatures and winds blowing from the south will give us warmer temperatures, this applies to ever point on the globe, averages will give you a figure, how reliable is the figure?
If Graham from Doncaster, Stephen from Lincoln and Harry from Sunderland all have their heating, on perhaps the met office calling it the warmest May on record shows the problems with averaging.
On a lighter note my heating kicked in at 4.30 and it a noisy old thing, woke my puppy up, so I'm up with her,
I blame climate change , nothing to do with me forgetting to switch it off,
 so she is sound asleep on my lap and I am chatting to random people on the internet, it a wonderful life.
 mike9009 said:
Diderot said:
'May' is all anyone could say; like 'likely' - even though each of those statements are pissing in the wind, fantasy land.
Address the real issue: only 58 weather stations between 1850-1900, 45 in Europe, and 510million km sq to cover. If you can't see an issue with that, then you need to enlist Specsavers. It's utterly hilarious
Needs to be in the science thread really. But I don't see why you cannot look for trends in one geographic location from 1850 to date? Address the real issue: only 58 weather stations between 1850-1900, 45 in Europe, and 510million km sq to cover. If you can't see an issue with that, then you need to enlist Specsavers. It's utterly hilarious
Then one can reverse extrapolate wider based on the wider distribution of data recorded in later years. Obviously it assumes the same global trends over the last two hundred years.....but we seem to go back millions of years using a globally accepted average temp.
Not seen data for the UK specifically in 10,200,000 BC scientifically presented yet.....so some extrapolation must have been applied to present the global trend data over the millions of years. The dataset is oft used to demonstrate climate change has always occurred. So why not question that dataset too?? No need to answer that, I know why.
I don't think that it is beyond the wit of man.
Or alternatively we could base climatic trends on the number of days Graham from Doncaster has had his heating on each month. But a little skeptical as this might involve averaging which is pretty hopeless.
Edited by mike9009 on Saturday 15th June 23:05
1. It's not just a lack of station but that what stations we have are clustered together. So using this method you will be applying trends to areas thousands of km away. We know for a fact even in the UK knowing the temperature in London is not a way to measure the temperature in Glasgow.
2. We know some stations will be returning incorrect data. The problem is we do not know which ones. The research eliminated station which where outliers. This might be valid when stations are cluster together. But eliminating a station data based on measurements at stations km is dubious.
3. You also have the problem of changes in the station environment and equipment.
Most of these problems cannot be overcome.
Older estimates have to rely on proxies. Which introduces a whole new level of unknown unknowns.
PRTVR said:
mike9009 said:
Diderot said:
'May' is all anyone could say; like 'likely' - even though each of those statements are pissing in the wind, fantasy land.
Address the real issue: only 58 weather stations between 1850-1900, 45 in Europe, and 510million km sq to cover. If you can't see an issue with that, then you need to enlist Specsavers. It's utterly hilarious
Needs to be in the science thread really. But I don't see why you cannot look for trends in one geographic location from 1850 to date? Address the real issue: only 58 weather stations between 1850-1900, 45 in Europe, and 510million km sq to cover. If you can't see an issue with that, then you need to enlist Specsavers. It's utterly hilarious
Then one can reverse extrapolate wider based on the wider distribution of data recorded in later years. Obviously it assumes the same global trends over the last two hundred years.....but we seem to go back millions of years using a globally accepted average temp.
Not seen data for the UK specifically in 10,200,000 BC scientifically presented yet.....so some extrapolation must have been applied to present the global trend data over the millions of years. The dataset is oft used to demonstrate climate change has always occurred. So why not question that dataset too?? No need to answer that, I know why.
I don't think that it is beyond the wit of man.
Or alternatively we could base climatic trends on the number of days Graham from Doncaster has had his heating on each month. But a little skeptical as this might involve averaging which is pretty hopeless.
Edited by mike9009 on Saturday 15th June 23:05
In its basic form we are looking at weather and wind direction, as we are seeing now, wind blowing from the north gives us cooler temperatures and winds blowing from the south will give us warmer temperatures, this applies to ever point on the globe, averages will give you a figure, how reliable is the figure?
If Graham from Doncaster, Stephen from Lincoln and Harry from Sunderland all have their heating, on perhaps the met office calling it the warmest May on record shows the problems with averaging.
On a lighter note my heating kicked in at 4.30 and it a noisy old thing, woke my puppy up, so I'm up with her,
I blame climate change , nothing to do with me forgetting to switch it off,
so she is sound asleep on my lap and I am chatting to random people on the internet, it a wonderful life. I agree with the statement about not enough data, but it can be statistically justified. I think the justification starts falling apart prior to 1880.
Which then questions the graphs presented frequwntly by Joey Essex which go back millions of years. Surely these are based on a few ice cores which is then extrapolated globally.
mike9009 said:
Sweet. I just put the thermostat at 16 which seems to keep everyone happy, even our dog ...
I agree with the statement about not enough data, but it can be statistically justified. I think the justification starts falling apart prior to 1880.
Which then questions the graphs presented frequwntly by Joey Essex which go back millions of years. Surely these are based on a few ice cores which is then extrapolated globally.
Yep, lots of ways of supporting the proxy data and not just ice cores. I agree with the statement about not enough data, but it can be statistically justified. I think the justification starts falling apart prior to 1880.
Which then questions the graphs presented frequwntly by Joey Essex which go back millions of years. Surely these are based on a few ice cores which is then extrapolated globally.
Proxy data is taken from bore holes, corals, glaciers, historical documents, lake sediment, Loess, marine sediment, pack rat middens, rock outcrops, seal pelts, Speleothems and tree rings.
Some info here (mostly about longer term record) for the incurious to ignore:
https://interactive.carbonbrief.org/how-proxy-data...
durbster said:
mike9009 said:
Sweet. I just put the thermostat at 16 which seems to keep everyone happy, even our dog ...
I agree with the statement about not enough data, but it can be statistically justified. I think the justification starts falling apart prior to 1880.
Which then questions the graphs presented frequwntly by Joey Essex which go back millions of years. Surely these are based on a few ice cores which is then extrapolated globally.
Yep, lots of ways of supporting the proxy data and not just ice cores. I agree with the statement about not enough data, but it can be statistically justified. I think the justification starts falling apart prior to 1880.
Which then questions the graphs presented frequwntly by Joey Essex which go back millions of years. Surely these are based on a few ice cores which is then extrapolated globally.
Proxy data is taken from bore holes, corals, glaciers, historical documents, lake sediment, Loess, marine sediment, pack rat middens, rock outcrops, seal pelts, Speleothems and tree rings.
Some info here (mostly about longer term record) for the incurious to ignore:
https://interactive.carbonbrief.org/how-proxy-data...
Mrr T said:
durbster said:
mike9009 said:
Sweet. I just put the thermostat at 16 which seems to keep everyone happy, even our dog ...
I agree with the statement about not enough data, but it can be statistically justified. I think the justification starts falling apart prior to 1880.
Which then questions the graphs presented frequwntly by Joey Essex which go back millions of years. Surely these are based on a few ice cores which is then extrapolated globally.
Yep, lots of ways of supporting the proxy data and not just ice cores. I agree with the statement about not enough data, but it can be statistically justified. I think the justification starts falling apart prior to 1880.
Which then questions the graphs presented frequwntly by Joey Essex which go back millions of years. Surely these are based on a few ice cores which is then extrapolated globally.
Proxy data is taken from bore holes, corals, glaciers, historical documents, lake sediment, Loess, marine sediment, pack rat middens, rock outcrops, seal pelts, Speleothems and tree rings.
Some info here (mostly about longer term record) for the incurious to ignore:
https://interactive.carbonbrief.org/how-proxy-data...

durbster said:
Mrr T said:
durbster said:
mike9009 said:
Sweet. I just put the thermostat at 16 which seems to keep everyone happy, even our dog ...
I agree with the statement about not enough data, but it can be statistically justified. I think the justification starts falling apart prior to 1880.
Which then questions the graphs presented frequwntly by Joey Essex which go back millions of years. Surely these are based on a few ice cores which is then extrapolated globally.
Yep, lots of ways of supporting the proxy data and not just ice cores. I agree with the statement about not enough data, but it can be statistically justified. I think the justification starts falling apart prior to 1880.
Which then questions the graphs presented frequwntly by Joey Essex which go back millions of years. Surely these are based on a few ice cores which is then extrapolated globally.
Proxy data is taken from bore holes, corals, glaciers, historical documents, lake sediment, Loess, marine sediment, pack rat middens, rock outcrops, seal pelts, Speleothems and tree rings.
Some info here (mostly about longer term record) for the incurious to ignore:
https://interactive.carbonbrief.org/how-proxy-data...
Mrr T said:
That's essentially what they do for the temperature charts from 1850. However, there are problems.
1. It's not just a lack of station but that what stations we have are clustered together. So using this method you will be applying trends to areas thousands of km away. We know for a fact even in the UK knowing the temperature in London is not a way to measure the temperature in Glasgow.
2. We know some stations will be returning incorrect data. The problem is we do not know which ones. The research eliminated station which where outliers. This might be valid when stations are cluster together. But eliminating a station data based on measurements at stations km is dubious.
3. You also have the problem of changes in the station environment and equipment.
Most of these problems cannot be overcome.
Older estimates have to rely on proxies. Which introduces a whole new level of unknown unknowns.
The correlation for trends is over a surprisingly long distance - 1000km, depending on location. So a station in London is not a good measure of absolute temperature for Glasgow but the trend in their temperature anomalies is probably the same.1. It's not just a lack of station but that what stations we have are clustered together. So using this method you will be applying trends to areas thousands of km away. We know for a fact even in the UK knowing the temperature in London is not a way to measure the temperature in Glasgow.
2. We know some stations will be returning incorrect data. The problem is we do not know which ones. The research eliminated station which where outliers. This might be valid when stations are cluster together. But eliminating a station data based on measurements at stations km is dubious.
3. You also have the problem of changes in the station environment and equipment.
Most of these problems cannot be overcome.
Older estimates have to rely on proxies. Which introduces a whole new level of unknown unknowns.
It would be interesting to see a comparison between a trend in global temperature in just the areas we have data from the 1850's Vs the the trend in the full data set.
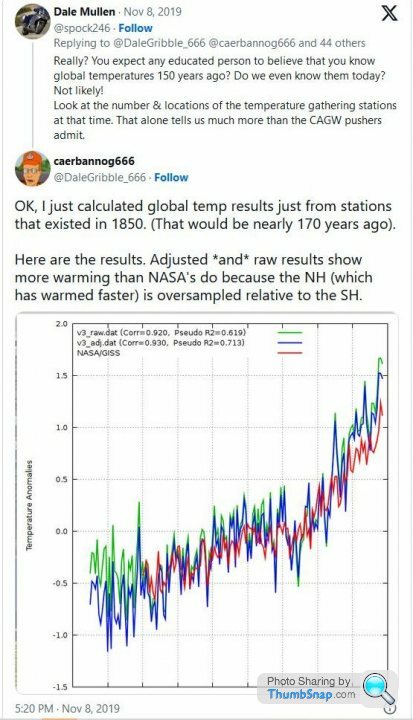
hairykrishna said:
The correlation for trends is over a surprisingly long distance - 1000km, depending on location. So a station in London is not a good measure of absolute temperature for Glasgow but the trend in their temperature anomalies is probably the same.
It would be interesting to see a comparison between a trend in global temperature in just the areas we have data from the 1850's Vs the the trend in the full data set.
Here you goIt would be interesting to see a comparison between a trend in global temperature in just the areas we have data from the 1850's Vs the the trend in the full data set.
Diderot said:
Even in the 1850-1900 period, there were only 58 weather stations recording temperatures around the world, with 45 of them in Europe.. You couldn't make it up, but it's actuality!
I don't think that's accurate. In the year 1850 perhaps (but I don't know) You couldn't make it up, but it's actuality!It's clearly not the case 1880 to 1900
You can look at the coverage for that period here
https://data.giss.nasa.gov/gistemp/maps/
Coverage improves over time. Here's 1900 with 250km smoothing:
Gassing Station | News, Politics & Economics | Top of Page | What's New | My Stuff